Skip to calculator
Supplier scorecard
Enter observed counts for a comparable period, using weights and definitions agreed by your team.
Browser only · no sign-upOBSERVED PERFORMANCE · Last 90 days
Supplier A: 93.2 / 100
- Weight with known observations
- 100%
- Criteria with observed rates
- 3 / 3
| Criterion | Observed rate | Weight / points |
|---|---|---|
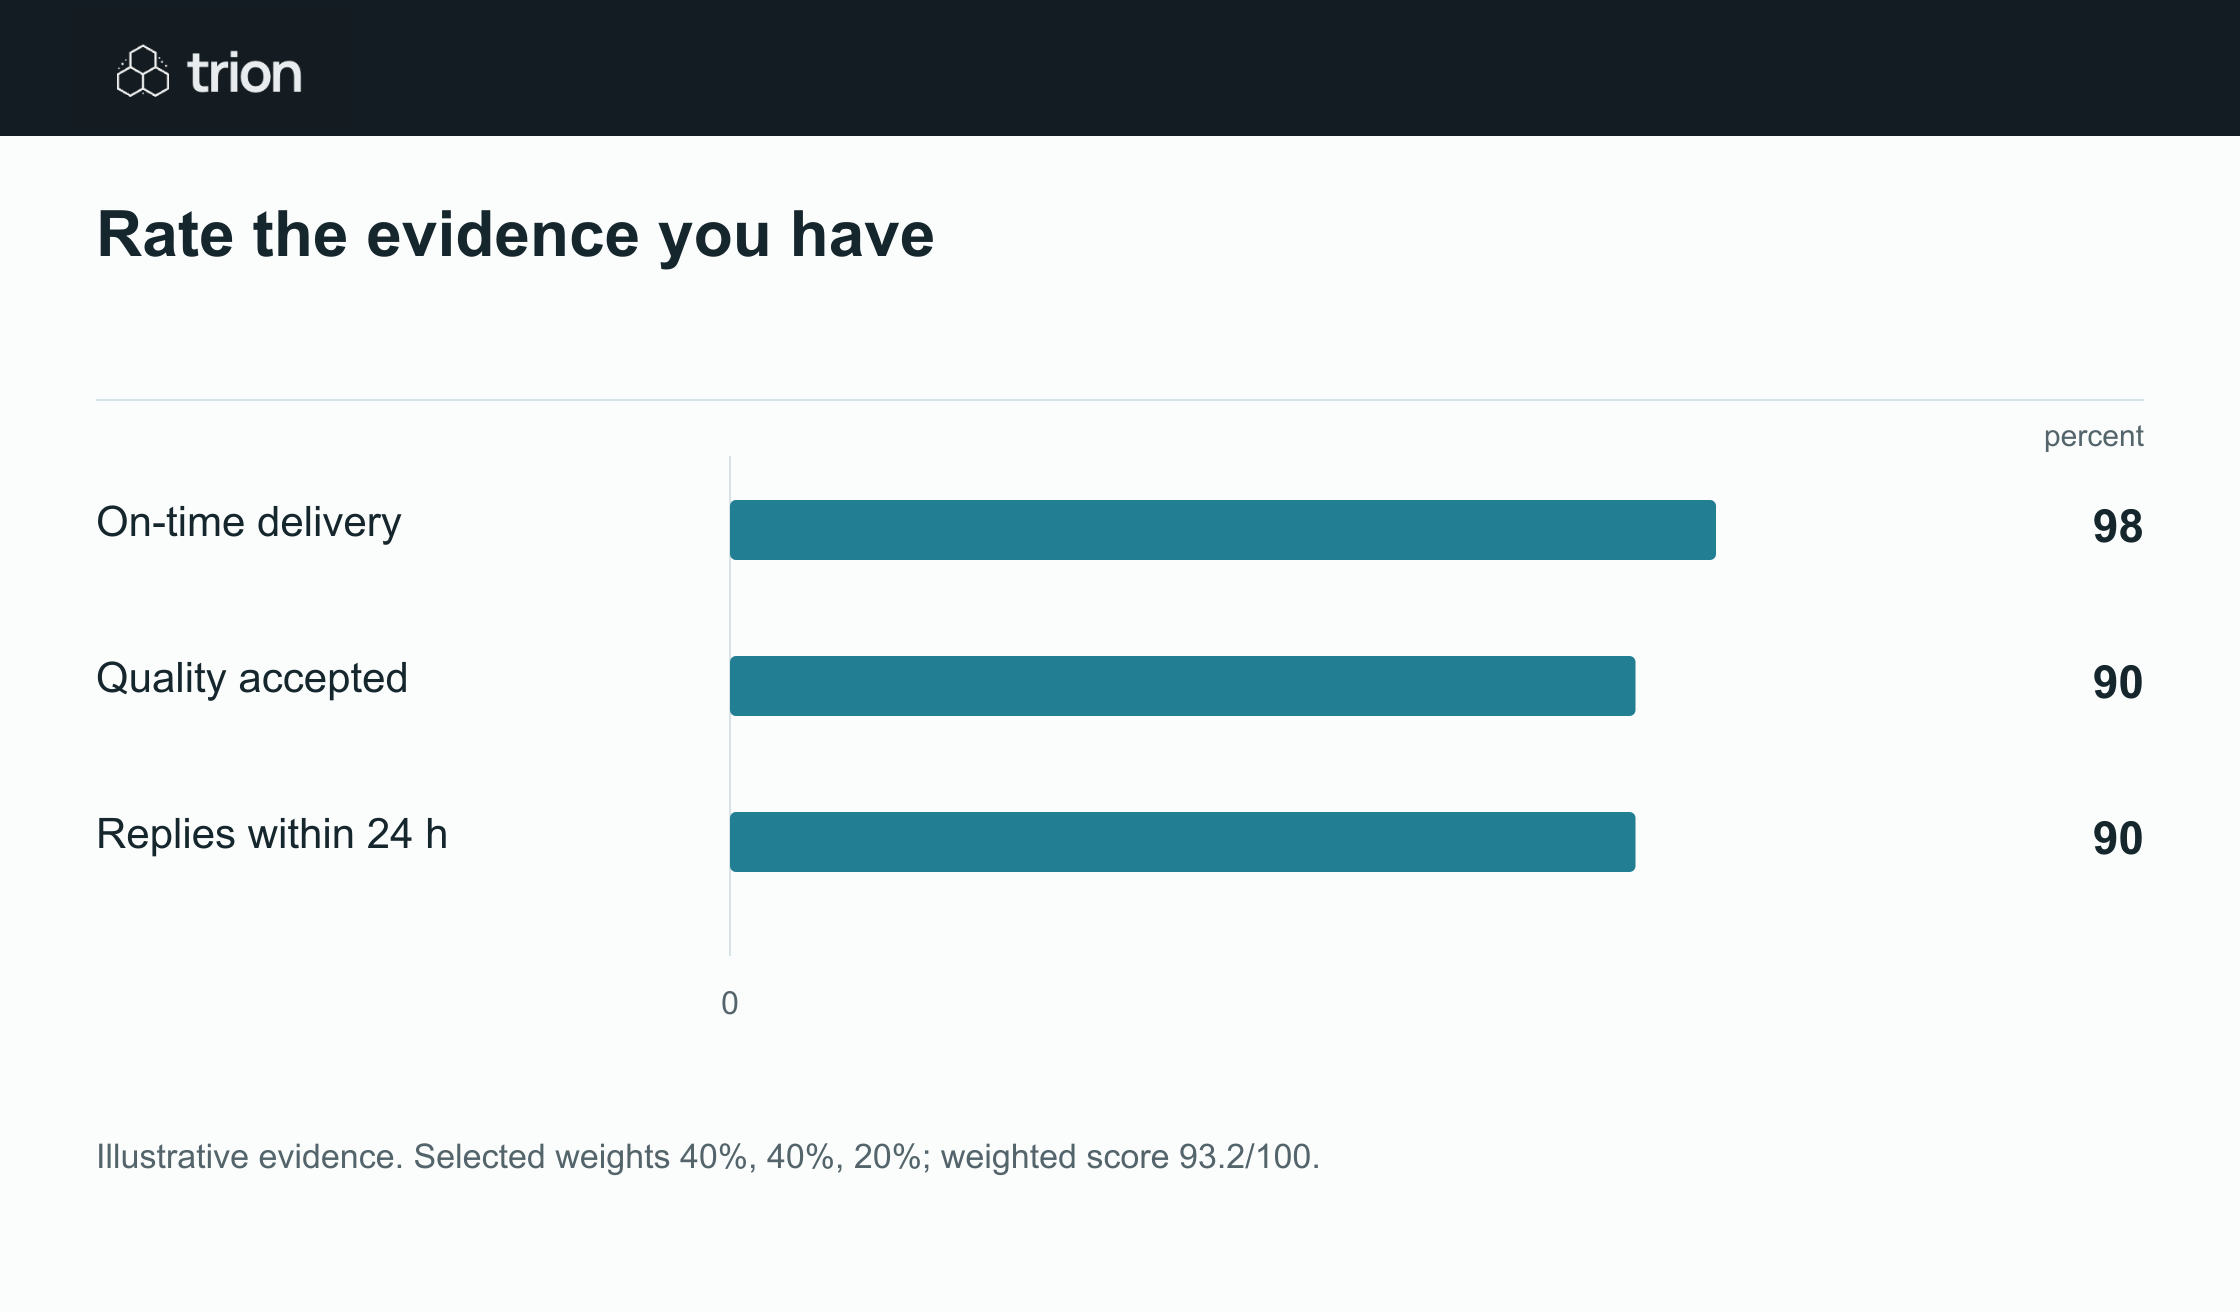
| On-time delivery98 / 100 deliveries | 98% | 40%39.2 points |
| Quality acceptance90 / 100 inspected units | 90% | 40%36 points |
| Replies within 24 hours90 / 100 timed replies | 90% | 20%18 points |
- Rates use the observed successful count divided by the recorded total. A recorded 0 out of a positive total is a measured 0%; a blank count or total of 0 is unknown.
- Weights are selected by you and must total 100%. Unknown weights are never assigned a rate or redistributed to the other criteria. Criteria with 0% weight remain visible but do not contribute to the total.
- Use consistent definitions, a comparable period and representative samples. A small denominator can produce a high rate without strong evidence. This score does not award work, verify a supplier or predict future performance.
How the score is calculated
Each observed rate = successful observations ÷ total observations × 100. Its contribution = rate × selected weight ÷ 100. The total is the sum of contributions only when every criterion with a nonzero weight has observations. Example: 98 × 0.4 + 90 × 0.4 + 90 × 0.2 = 93.2 out of 100.
Example PNGIllustrative evidence. Selected weights 40%, 40%, 20%; weighted score 93.2/100.