
A supplier scorecard is useful when the team can explain each measure, reproduce it from evidence and agree on the next action. An attractive total score cannot repair inconsistent definitions or missing observations.
Choose measures that answer an operating question
Start with questions the supplier review should resolve. Are deliveries meeting the agreed dates? Are received items accepted without defects? Are commercial questions answered within the agreed interval? Select a small set of measures with evidence your team can maintain. Do not add a compliance score simply because it appears in another company's template.
SAP's scorecard guidance describes key indicators such as quality, delivery and service, with weights reflecting their importance. Its template model requires indicator weights to total 100. The particular measures and weights below are an original worked example, not SAP defaults or industry benchmarks. Read SAP's scorecard template guidance.
Write the definitions before calculating
For on-time delivery, decide whether the event is an order, order line or shipment, and which agreed date applies. For quality, define accepted units and the inspection interval. For response, define the questions included, response deadline and treatment of incomplete answers. Keep the review period and supplier category visible.
| Measure | Illustrative definition | Data owner |
|---|---|---|
| On-time delivery | Due order lines delivered by agreed date ÷ eligible due lines | Receiving and buyer |
| Accepted quality | Accepted inspected units ÷ inspected units | Quality reviewer |
| Timely complete response | Questions fully answered by agreed deadline ÷ eligible questions | Buyer |
Document exclusions, such as a buyer-requested postponement, and keep their evidence. Choose the treatment before seeing the result. Changing the denominator after a poor month makes the score hard to compare with earlier periods.
A worked scorecard with three measures
In a fictional quarter, a supplier has 20 eligible due order lines, with 18 delivered on time. Delivery is 18 ÷ 20 = 90%. Quality staff inspect 200 units and accept 196, giving 98%. The buyer has ten eligible commercial questions, with nine fully answered by the agreed deadline, giving 90%.
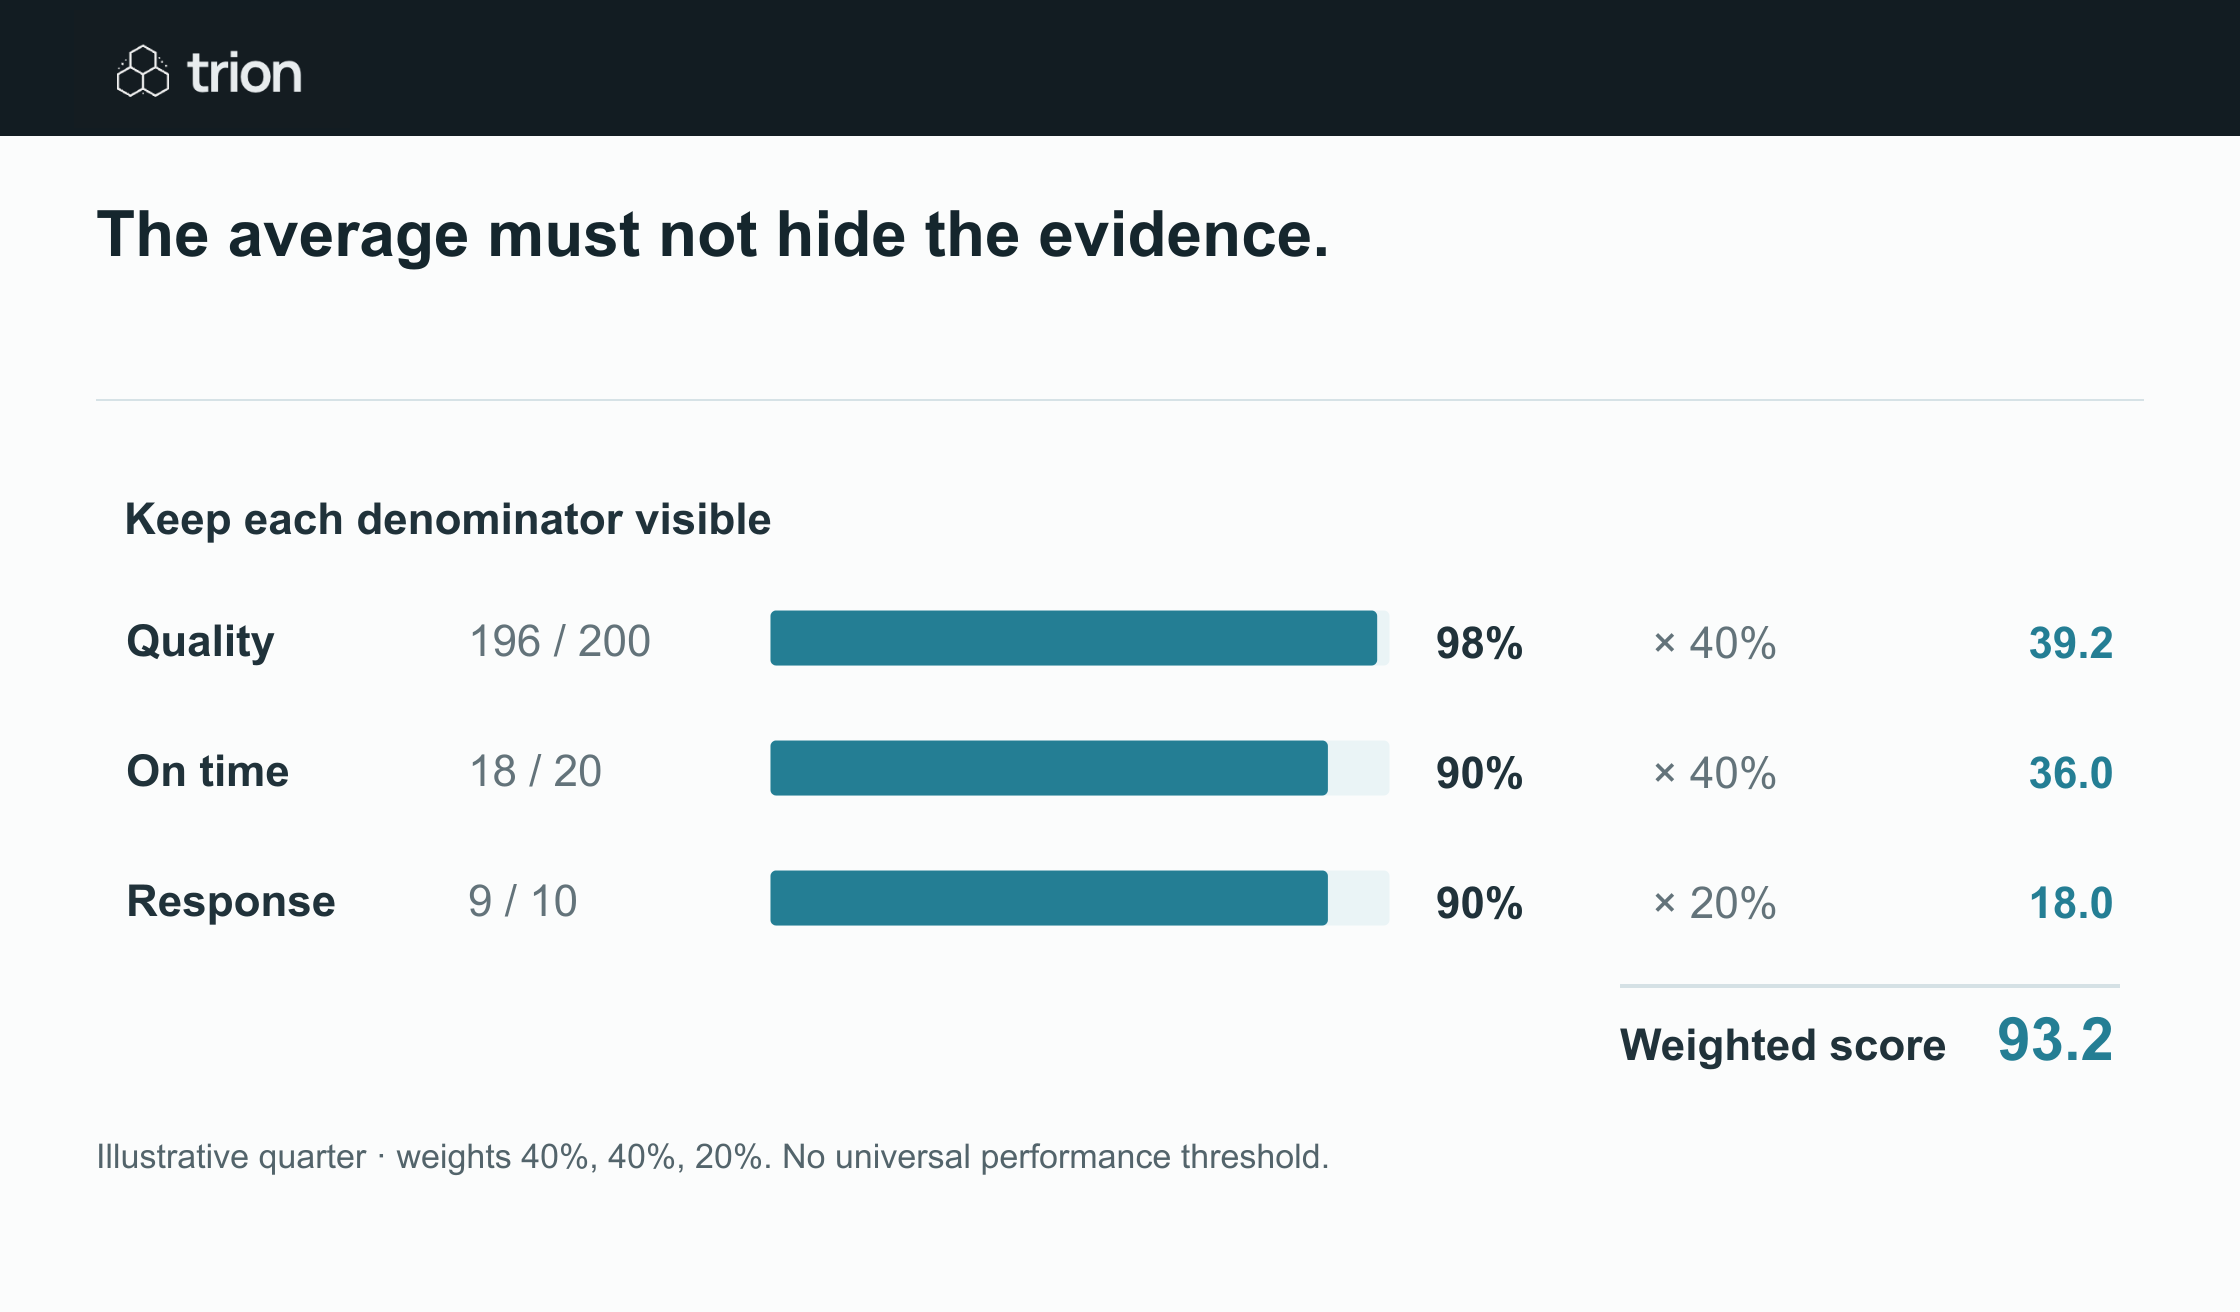

The average must not hide the evidence.
- Quality
- 196 of 200 = 98%; weight 40%; contribution 39.2
- On-time deliveries
- 18 of 20 = 90%; weight 40%; contribution 36.0
- Responses
- 9 of 10 = 90%; weight 20%; contribution 18.0
- Weighted score
- 93.2 of 100; inspect evidence and denominators
View data
| Evidence | Meaning |
|---|---|
| Quality | 196 of 200 = 98%; weight 40%; contribution 39.2 |
| On-time deliveries | 18 of 20 = 90%; weight 40%; contribution 36.0 |
| Responses | 9 of 10 = 90%; weight 20%; contribution 18.0 |
| Weighted score | 93.2 of 100; inspect evidence and denominators |
Illustrative quarter · weights 40%, 40%, 20%. No universal performance threshold.
Download imageFor illustration, the category owner assigns quality 40%, delivery 40% and response 20%. Because these example measures all use a higher-is-better percentage scale, the weighted result is 98 × 0.40 + 90 × 0.40 + 90 × 0.20 = 93.2 out of 100. Show the three measures next to that total; otherwise the four rejected units disappear behind a strong average.
The score is not an automatic award decision. The rejected units may be minor cosmetic issues or a serious failure affecting safety or production. The review needs the underlying events and severity, not a number alone.
Do not turn missing data into good performance
If there are no eligible questions in the period, response is unavailable for that period, not 100%. If inspection results are missing, quality is unknown, not zero defects. Decide how the total is reported: incomplete, or an explicitly labeled partial score under a pre-agreed rule. Never silently redistribute weights and present it as the full score.
Keep observation counts visible. A supplier with one perfect delivery and one with fifty deliveries have different evidence behind the same percentage. Compare suppliers in relevant categories and periods, and check whether the work was genuinely similar before creating a ranking.
Freeze definitions and record corrections
Store the measure definition, weighting version, review dates and source references. If a receiving record is corrected, update the affected result with a reason. If the category owner changes the weights, use a new dated version and explain whether earlier periods were recalculated or remain under the old method.
A disputed date should enter a review queue with the original commitment, any agreed amendment and the receipt evidence. The buyer and supplier can then resolve the factual record. Automation can assemble that packet; it should not rewrite the commitment merely to improve the on-time score.
Turn the review into an action plan
Assign each material issue an owner, action and review date. For the example, quality staff investigate the four rejected units while the buyer agrees an improvement action with the supplier. Track whether the action was completed and whether later evidence changes the measure.
Use the readiness check to assess whether the source records and owners exist. The spreadsheet automation guide explains stable records and updates. Begin with a reproducible scorecard and an honest exception list before asking AI to summarize supplier performance.