
Claude adds live dashboards and animated explainers
Claude now has two new artifact formats in beta: live dashboards and animated explainers. Anthropic is also moving Docs, Slides and Design out of beta across its plans, including Free.
Inspect the work behind the output
The Dashboards and Motion announcement describes dashboards connected to data warehouses or other apps. Charts expose the query that produced the number and show when the data last refreshed. Anthropic’s dashboard guide lists Pro, Max, Team and Enterprise availability; Enterprise owners must enable it.
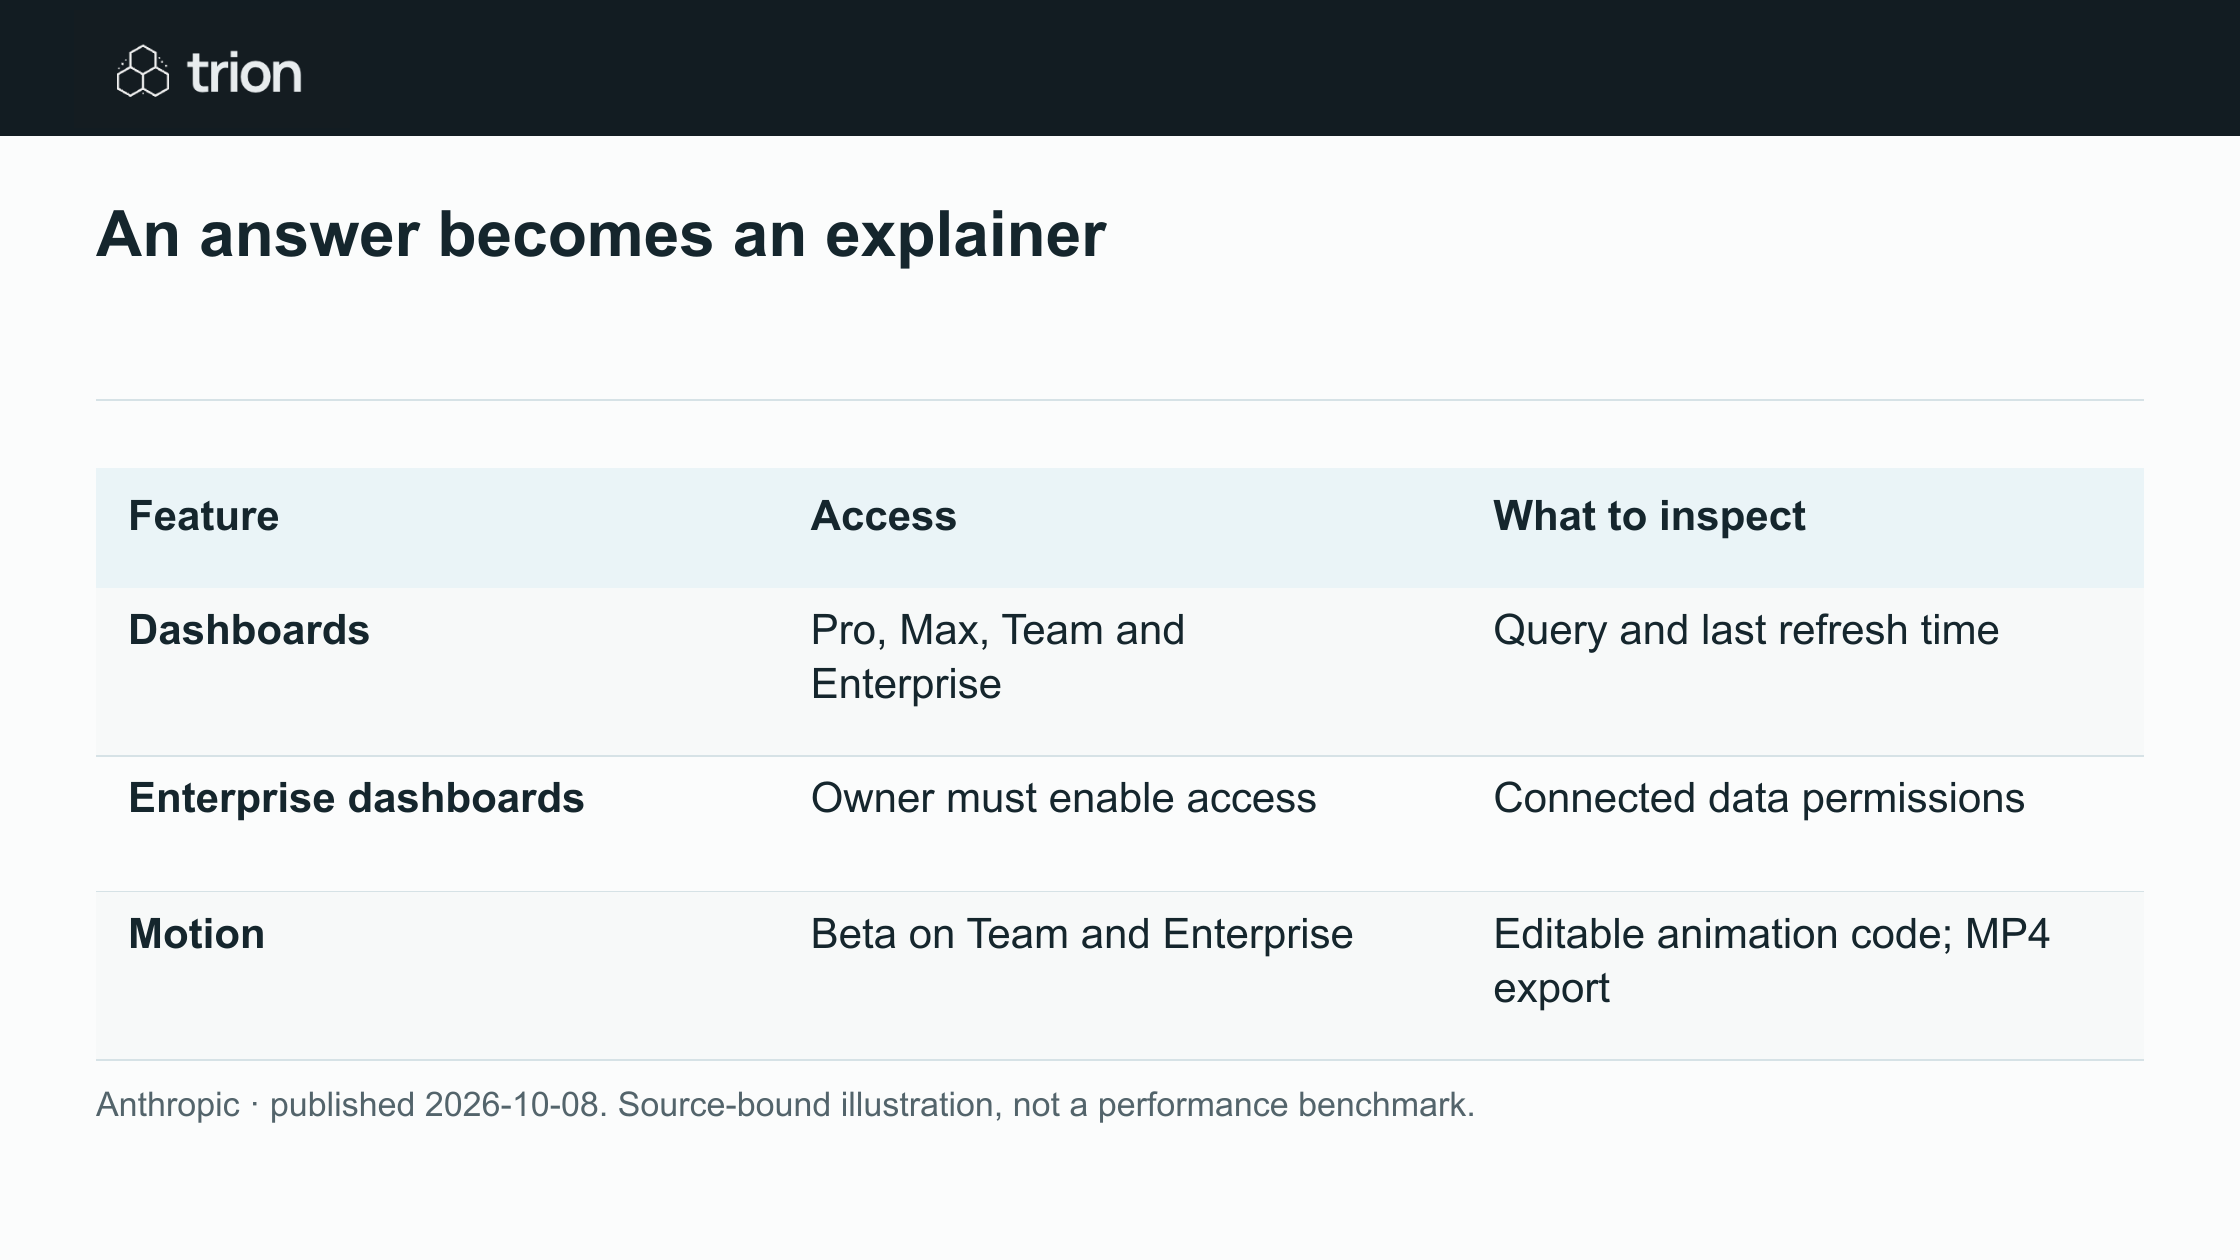

An answer becomes an explainer
- Dashboards
- AccessPro, Max, Team and Enterprise
- What to inspectQuery and last refresh time
- Enterprise dashboards
- AccessOwner must enable access
- What to inspectConnected data permissions
- Motion
- AccessBeta on Team and Enterprise
- What to inspectEditable animation code; MP4 export
View data
| Feature | Access | What to inspect |
|---|---|---|
| Dashboards | Pro, Max, Team and Enterprise | Query and last refresh time |
| Enterprise dashboards | Owner must enable access | Connected data permissions |
| Motion | Beta on Team and Enterprise | Editable animation code; MP4 export |
Anthropic · published 2026-10-08. Source-bound illustration, not a performance benchmark.
Download imageMotion is in beta on Team and Enterprise. It animates text, charts, shapes and images using editable code and can export an MP4. Anthropic distinguishes this from generated video footage. A dashboard is aimed at exploratory questions, with deeper analysis continuing in connected analytics tools.
Original sources
- Anthropic: original announcementclaude.com
- Claude Dashboards help guidesupport.claude.com
Checked 9 Oct 2026 · A manually curated edition. Availability may change; company performance claims are not Trion test results. Editorial method.